Three Claude Code Mods I Built, and Why
I live in Claude Code these days — terminal, desktop app, both. And like any tool you use for hours a day, the little annoyances pile up until one afternoon you stop working and go fix them instead.
So I built three mods. Small, MIT licensed, on GitHub. Grab them if they sound like your setup too.
Two annoyances
Running out of usage mid-thought. You’re deep in something, the session stops, and that’s when you learn you burned through your 5-hour window. No heads up, no chance to pace yourself.
“Wait, which cluster is this?” Not even an AI problem — the oldest DevOps problem there is. I juggle a few Kubernetes clusters and AWS profiles. My shell prompt tells me where I’m pointed. Claude Code’s prompt? Nothing. So I’d scroll back through the terminal hunting for the last kubectl config use-context, which is not a safety mechanism. It’s a vibe.
Same problem both times: what I need in order to decide is somewhere other than where I’m looking.
Claude Code lets you install plugins that hook into the session and draw their own UI — a band above the prompt, a pane next to the chat. Which is all I needed.
limits-meter
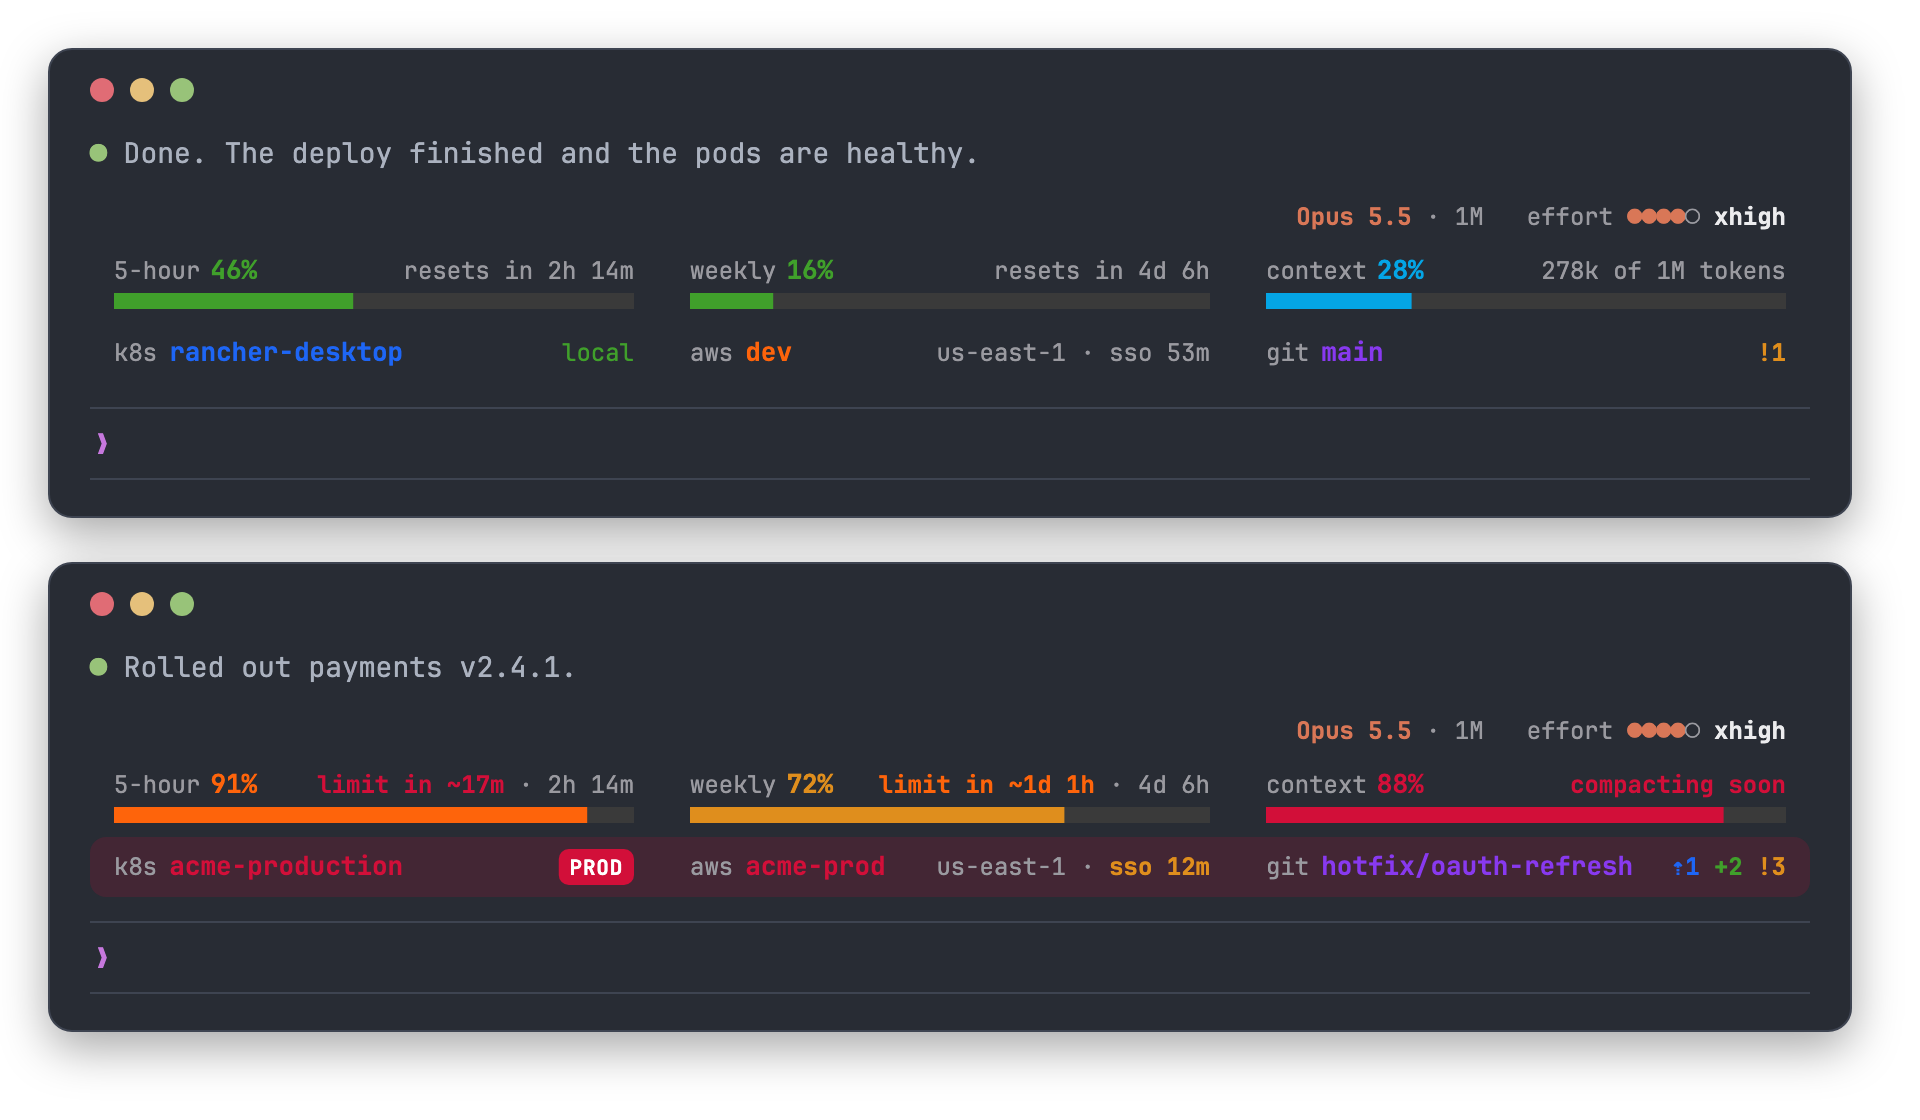
Three columns above the prompt: 5-hour limit, weekly limit, context window. Percentage, bar, reset time. It stays quiet until there’s something worth saying — if your pace will run you dry before the reset, it says limit in ~17m instead of handing you a number to do math on.
The context column is the one I stare at most. Seeing a conversation creep toward auto-compaction means I wrap up on my terms instead of getting compacted halfway through something and losing the plot.
where-am-i
One line underneath: Kubernetes context and namespace, AWS profile with SSO time left, git branch. Anything pointing at production and the whole line goes red with a PROD badge. Staging and preprod get amber, local clusters get green.
How I use it: I don’t. That’s the point. It’s there so that on the day I’m tired and about to ask for something destructive, half my screen turns red first.
(It reads the config files directly instead of shelling out to kubectl — the desktop app doesn’t inherit your shell’s PATH, so the CLIs just don’t work there.)
subagents
A pane with one card per subagent: type, task, running or done, call count, latest tool call.
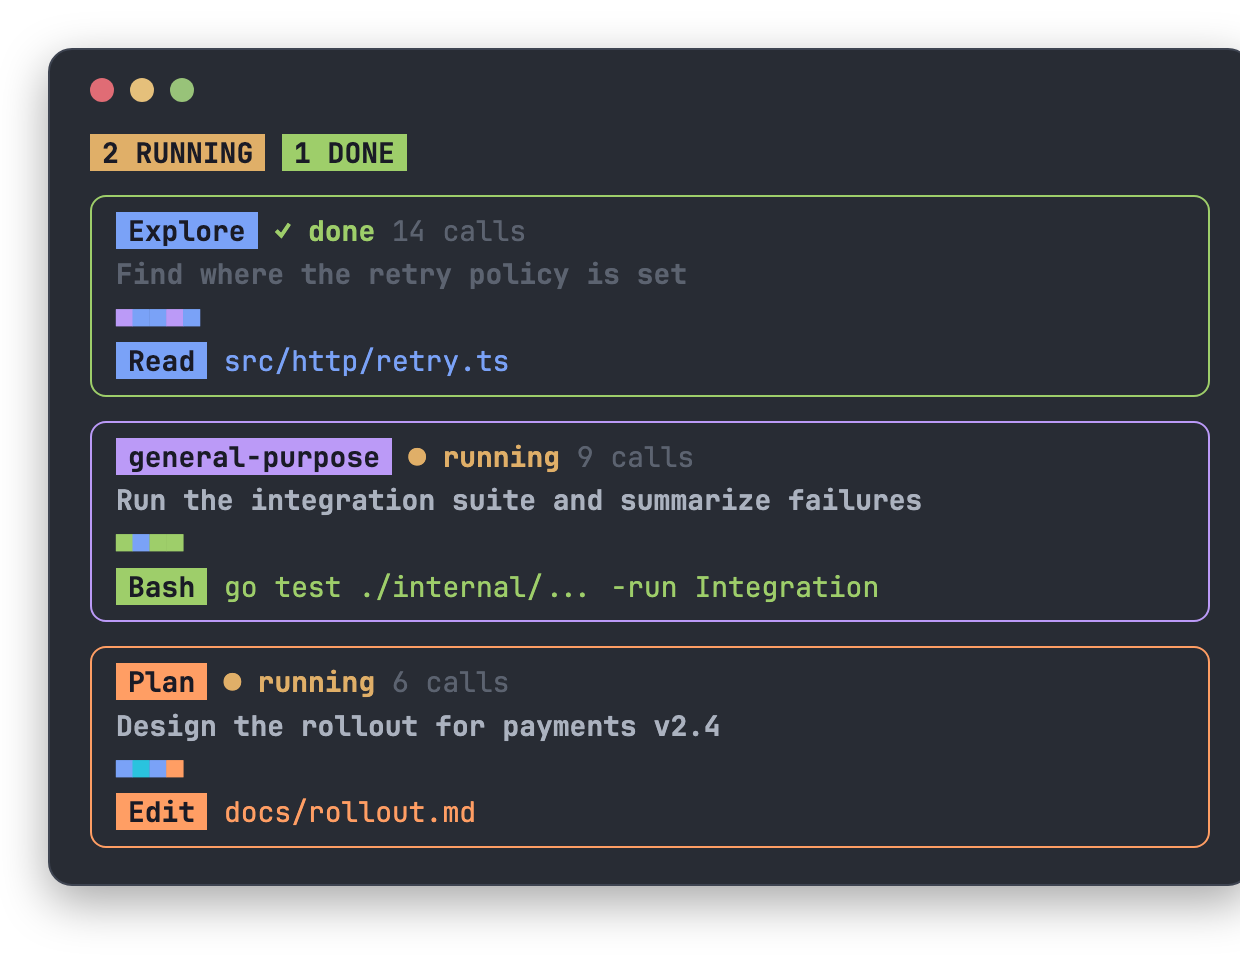
Least essential of the three, easily my favorite. Parallel agents used to feel like waiting in a dark room. It’s also a brutal feedback loop on your own prompts — give an agent a vague task and you watch the call count climb while the tool calls wander around.
Grab them
/plugin install limits-meter --marketplace luisgb14/benlabs-mods
/plugin install where-am-i --marketplace luisgb14/benlabs-mods
/plugin install subagents --marketplace luisgb14/benlabs-mods
They stack, so take one or all three. If your clusters don’t follow my naming conventions, the patterns live at the top of where-am-i/hooks/probe.ts — meant to be edited. Go wild.
None of this is clever. It’s three pieces of information moved to where I was already looking, which is most of what good tooling does: not new capability, just deleting the pause where you go check something before you can act.
If you keep checking the same thing, and it’s cheap to display, display it.
Code’s here: luisgb14/benlabs-mods. Take what’s useful.